Stop making search optimizations based on your gut feeling
You are running a website with lots of users. These users want to buy something, find the latest news, find a nice restaurant. You have learned from the internet that users that use search are more likely to stick around or buy something, at least if the search provides the right experience. You are not sure if that is the case for your website. Does your site offer the right user experience?
You want to validate this assumption on your website, but how? What reports do you need, what KPI’s should you consider? This article discusses the different KPI’s you need and how to collect them.
Introduction
Every website with a large amount of content like products or articles offers search functionality to its users. Overall, users have other options to buy products. These options can be using the search engine underneath, or direct links from a search engine like Google. However, often, users that do use the search box on your site tend to stay longer and buy more. Now is the moment you should ask me these questions: “Sure, but does this work for my site as well?”, “What should I do when it does not work for me?” and “How do I track users on my site?”. It is not uncommon to see a 5 to 10 times higher conversion rate for people using the onsite search engine in contrast with people that do not.
You can track how well your onsite search solution is performing using Key Performance Indicators (KPIs). Using KPIs like conversion, you can determine the impact of search on your users. You can also use KPIs to learn how your onsite search solution is used. Think about KPIs for the number of queries without a result and query results without interaction. In this article, we discuss the top KPI’s that you should monitor for an onsite search solution. We group the KPI’s in three different categories: Used search terms, found results, and interaction with the results. There are a lot of different tools that can help you to track your users. Apparent choices are Google analytics or Adobe analytics. These tools have search metrics available; however, too little out of the box. Google can use tools like Google Tag Manager. Another option is to create your data pipeline that is capable of receiving and handling all website events. There are a lot of cloud-based platforms that facilitate this architecture.
KPIs for used search terms
Users can type all sorts of different queries or search terms. The intent for each search term is not always clear. It could be different from user to user and even from situation to situation. Metrics do not always clarify the intent of the user. Still, it remains essential to look at the search term metrics to get an idea about what users are looking for. In the case of an online book store, they could be searching for book titles, authors, genres. Another area is the diversity of queries. Does everybody use the same terms, or do they look for very different things? Head versus Tail — When analyzing the used queries, we separate the head from the tail. The head is the part with the terms that your users use the most. Usually, the head is around the top 20% of the terms that generate around 50% of your income. Optimizing the head is often easier than optimizing the tail. They both represent half your income, but having a good tail behavior makes the difference with your competitors.
KPIs for found results
Next to analyzing the search terms, you learn a lot from analyzing the results. By analyzing the search results, you get an idea about items that are seen regularly. You can learn about the used search terms to find the same result. The metrics also provide insight into the different categories of items that are found. In the case of an eCommerce website with very different groups of products, the metrics tell you if some categories are found more often than others. In the case of different suppliers, metrics can indicate those suppliers that enter metadata wrong to get better search positions. The zero results metric is another essential metric. This metric deals with search terms that do not return any results. Additional metrics are required to understand why these search terms do not return any results. Think about typos, using too many words, searching for things that are just not available. Helping users find what they are looking for — In an ideal world, the content is written in a language that your users understand. In a perfect world, your users do not make mistakes, and you understand completely what your users are looking for. However, we are not living in an ideal world. Search engines provide technologies to overcome these mistakes like stemming and fuzzy search. To better understand your users, you want to get an idea about the effectiveness of your users as well. Using Machine Learning, you can analyze your user’s sessions.
KPIs for interaction with results
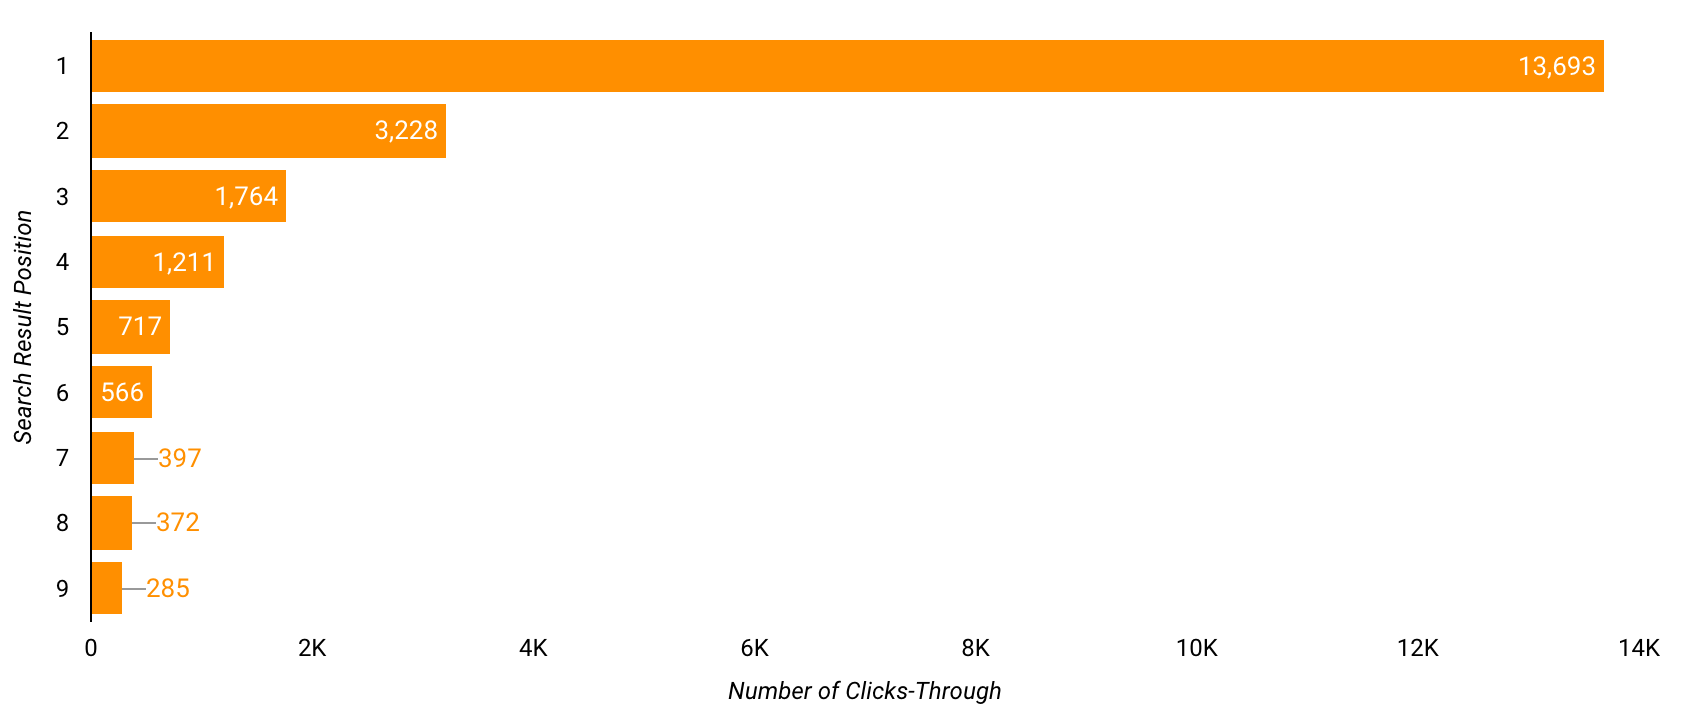
The real quality of your search engines appears from the way actual users make use of it. Without tracking how your users are interacting with the results, you will never know how your search engine is performing. An Essential KPI is the Click Trough Diagram that shows which items in the list are clicked. Theoretically, the clicks from position one in the list to position ten should decrease exponentially. Another metric is the search terms with results that are never clicked, indicating no conversion, or for which users always go to the second page of results.
Comparing sessions with and without using search
Besides these search specific queries, you should also monitor the differences in standard website metrics between sessions with and without using search. You should monitor metrics like bounce percentage, conversion, time on site, average session value.
The first step
After reading this article, you could be in doubt about the current status of your search engine. You wonder what the performance of your search engine is and how your users are interacting with it. Maybe you have some metrics through familiar tools like Google Analytics or a custom system. Do you know how to use it? Do you have all the essential metrics available? Feel free to contact me in case of questions or if you are in search of help.